


Today is the first day of spring, but many plants in Southern California had their first bloom before Groundhog Day on Feb. 2. While the East has been hit by winter storm after winter storm, it’s been planting season in Southern California for a month. The map above from the National Phenology Network shows the number of growing degree days (days with temperature high enough to grow plants) since Jan. 1.
2017 compared to 2018
The maps below show how early or late spring has come compared to the average for data from 1981-2010. In 2017, spring arrived very late in Southern California, but this year it was early.

2018 map

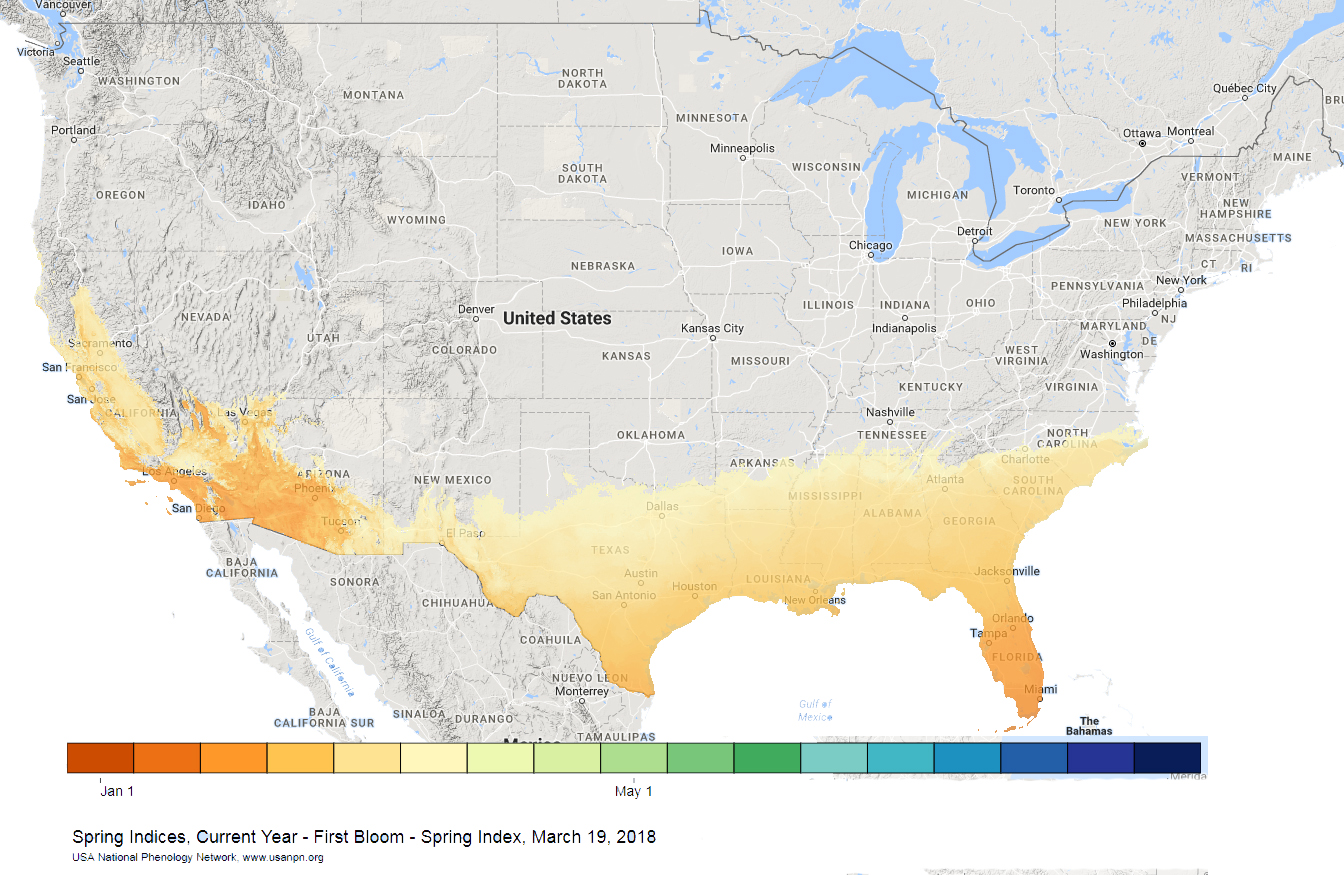
First bloom
The map below was made by the USA National Phenology Network and the USGS. It shows the dates of first bloom for species Zabelii honeysuckle, Arnold Red honeysuckle, and Red Rothomagensis lilacs calculated using National Centers for Environmental Prediction data. These plants are common in North America.
Science of the seasons[hhmc]
Phenology is the study of cyclic and seasonal natural phenomena, especially in relation to climate and plant and animal life. In a state like California with much of the nation’s agribusiness, the the science of the seasons is very useful for farmers.
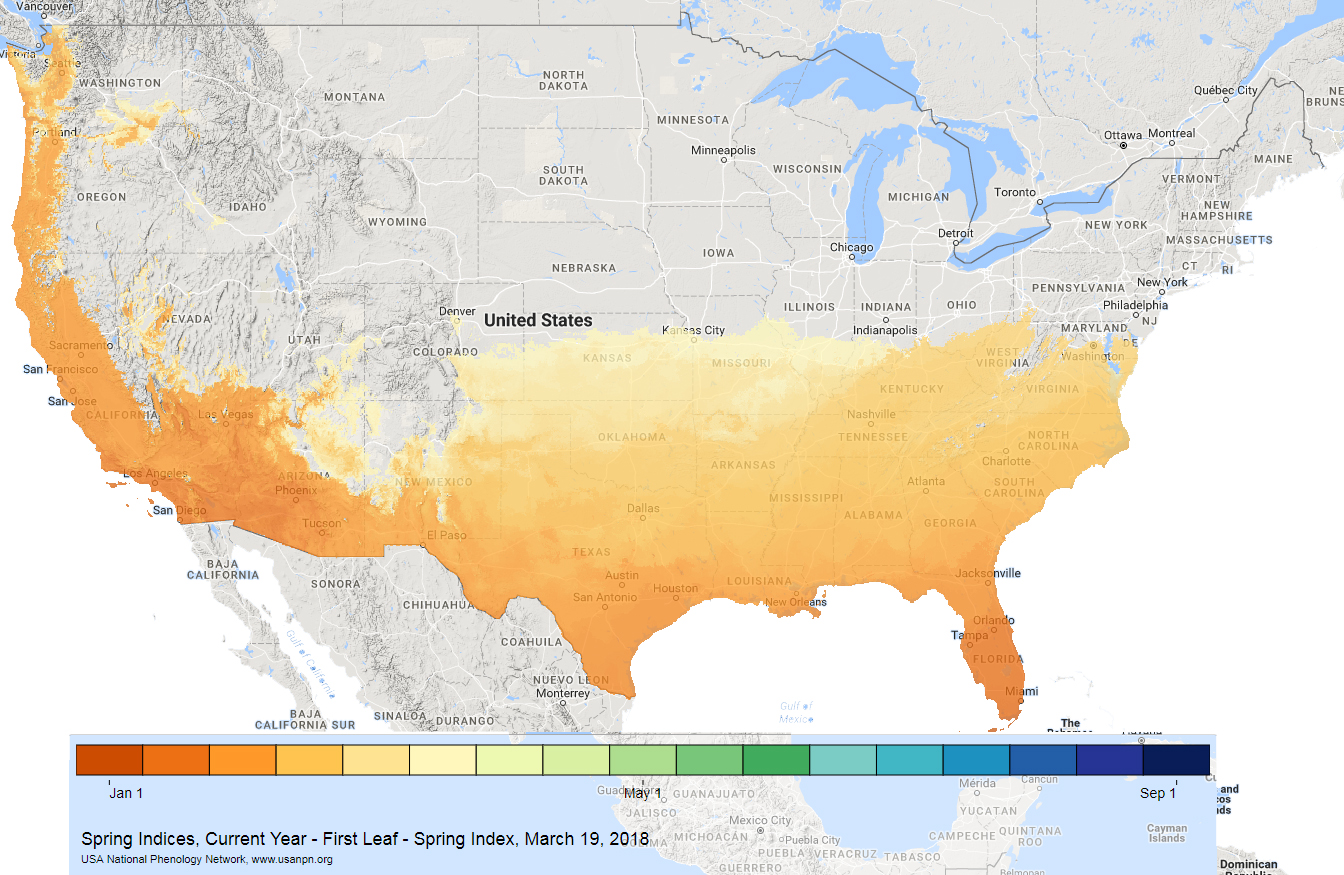
First leaf
This map shows the “start of spring” by the timing of the first leaf out for the same plants monitored in the first bloom map.
The USA National Phenology Network relies on thousands of volunteer observers, research scientists, resource managers, and educators around the country to participate in recording information in nature. If you would like to pay a little closer attention to leaf changes and wildlife in your backyard you might enjoy contributing your information. You can sign up to help record information for Nature’s Notebook as a citizen scientist here.
The network is celebrating its tenth year of data collection this month.
Pest maps
Another practical use for the science of spring is being able to monitor pest detection and how to control them. The USA National Phenology Network tracks several harmful pests and informs people of when and what to look for. The map below shows the forecast for an invasive species called the hemlock woolly adelgid and that it’s time to look for its eggs. You can forecast maps for four other pests here.

[contf] [contfnew] 
daily news
[contfnewc] [contfnewc]


